Opis budowy domowego termometra już był, dzis czas na opis konfiguracji jakiegoś “logera” tych informacji dla potomnych.
Opisze bardzo mało znane narzędzie dtgraph v0.4n.
Do prawidłowego działania DTGraph wymaga oczywiście serwera WWW z obsługą PHP oraz serwer mysql oraz moduł PHP generujący JPG.
Ja jako demona www używam Apache w wersji 2.4.6, PHP w wersjii 5.5.6-1 oraz mysql 5.5.-33.1
apt-get update

apt-get install apache2 php5 mysql-server phpmyadmin libphp-jpgraph nano php-mdb2-driver-mysql php-pear

pear install MDB2-2.4.1
Teraz pobieramy ze źródeł dtgraph’a lub stąd -> http://pliki.gru.one.pl/01-2014/dtgraph-0.4n.tar.gz
Polecam pobrać sobie to na komputer na którym mamy jakies środowisko graficzne, będzie łatwiej.
Po wypakowaniu mamy strukturę katalogów, a nas interesuja dokładnie dwa katalogi czyli SQL i WWW.
Zawartośc katalogu WWW należy przesłać np poprzez SCP do katalogu /var/www na naszym serwerze.
Ja mam to w katalogu /var/www/dt
Zawartośc katalogu SQL – tam właśnie są tabele bazy danych które musimy wgrać do naszej bazy mysql.
Wchodzimy przeglądarką na nasz serwer http://<ip_serwera>/phpmyadmin logujemy się na konto root z uzyciem naszego hasła roota.
Teraz należy wyklikać sobie nową tabelę, moja ma nazwę temperatura, a do tej bazy importujemy wpisy zkatalogu DTGrapha
- mysql_create_digitemp_metadata
- mysql_create_digitemp
- mysql_create_digitemp_alarms
Po zaimportowaniu tych 3-tabel praca w phpmyadmin jest skończona, teraz zostało skonfigurowanie reszty.
W plikach DTGrapha znajduję sie conf.php
To już można wykonać w konsoli, czyli:
nano /var/www/dt/conf.php
Ukaże się nam plik konfiguracyjny:
<?php
/*
* DTTemp Configuration File
*
* Structure loosely based on horde's components
* (www.horde.org)
*/
/************** PHP config **************************/
// Ubuntu has E_NOTICE on - which causes problems sometimes.
// Also, Some MDB2 versions have deprecation
// Comment this out if you don't want this app to change your log
// level (applies to this app only)
ini_set('error_reporting', E_ALL & ~E_NOTICE & ~E_DEPRECATED);
/************** Database Properties *****************/
/****************************************************/
$conf['driver'] = 'sql';
$conf['sql']['phptype'] = 'mysql'; //typ bazy - pozostawiamy mysql
// What protocol will we use to connect to the database. The default
// is tcp, but if you wish to use UNIX sockets, change it to 'unix'.
$conf['sql']['protocol'] = 'tcp';
// If you are using UNIX sockets, you may need to specify the socket's
// location.
// $conf['sql']['socket'] = '/var/lib/mysql/mysql.sock';
// What port is the database server running on? Not required for all
// databases.
$conf['sql']['port'] = 3306; wskazujemy port, domyslnie opcja zakomentowana, wystarczy wpissac port standardowy to 3306 i odkomentowac linie
// What hostname is the database server running on, or what is the
// name of the system DSN to use?
$conf['sql']['hostspec'] = 'localhost'; //host bazy, zazwyczaj localhost
// What username do we authenticate to the database server as?
$conf['sql']['username'] = 'root'; // uzytkownik bazy
// What password do we authenticate to the database server with?
$conf['sql']['password'] = 'TWOJEHASLO'; // twoje haslo do konta
// What database name/tablespace are we using?
$conf['sql']['database'] = 'temperatura'; // nazwa stworzonej bazy danych przez Ciebie
//Main table name that digitemp_mysql.pl logs to
$conf['sql']['table'] = 'digitemp'; // te wartości pozostawiamy standardowe, jeśli nie zmianialiśmy naz tabeli
//Metadata table describing available sensors
$conf['sql']['table_meta'] = 'digitemp_metadata';
//Alarms table describing raised/old alarms
$conf['sql']['table_alarms'] = 'digitemp_alarms';
// What charset does the database use internally?
$conf['sql']['charset'] = 'iso-8859-1';
/********************* LOGGER **********************/
/****************************************************/
// This is for the script that will insert current
// readings into the database (PHP version).
// This is optional - it is needed only if you logger.php (on cron)
//$conf['digitemp_binary'] = '/usr/local/bin/digitemp';
$conf['digitemp_binary'] = '/usr/bin/digitemp_DS9097';
$conf['digitemp_config'] = '/root/.digitemprc';
/************** JPGraph Properties ******************/
/****************************************************/
//The dir path under which jpgraph.php and others can be found
//This may be relative or absolute (filesystem, not url)
$conf['jp_path'] = "/usr/share/jpgraph/";
/************** Graph Properties ********************/
/****************************************************/
$conf['graph'] = array(); //leave this line alone!
//The colors define the graph colors in reverse order
//The colors now come from the metadata table, but
//these are defaults for yet undescribed sensors
$conf['graph']['colors'] = array("black","gray","blue","red","green","yellow","magenta","purple");
//Background color of the graph image
$conf['graph']['bgcolor'] = '#F0F0FF';
//Graph size below (in pixels):
$conf['graph']['width'] = 800;
$conf['graph']['height'] = 600;
//$conf['graph']['width'] = 640;
//$conf['graph']['height'] = 480;
$conf['data'] = array(); //leave alone
/*** UNITS ****/
//Temp display units. Logging is assumed to be done in fahrenheit
//(As is suggested by the schema)
//Possible values are : "celsius", "fahrenheit"
//Note that changing this changes default,
//as well as changing the checkbox in the inteface to offer the
//other unit of measurement instead
//$conf['data']['units'] = 'fahrenheit';
$conf['data']['units'] = 'celsius';
/*** Precision ***/
//Number of digits to show after decimal point
//in stats, etc
$conf['data']['displayPrecision'] = 2;
/**** Initial ****/
//negative number of seconds to set start time to
//when the page is first visited
$conf['data']['defaultOffset'] = -3600 * 12; //3 hours ago
//same for alarm viewer
$conf['data']['alarmsDefaultOffset'] = -3600 * 24 * 60; //two months
// Safeties on incoming data:
$conf['data']['loggerValidTempMin'] = -80;
$conf['data']['loggerValidTempMax'] = 180;
// Default states of main interface checkboxes
$conf['data']['defaults'] = array(
'show_stats' => true,
'showLegend' => false,
'showMargin' => false,
'showMarks' => true,
'showBands' => false,
'showNegatives' => true,
'datesAbsolute' => false,
'showRepeats' => false,
'showAll' => false,
'showAlarms' => false,
// toggleUnits is handled above: $conf['data']['units']
);
/**** THIN OUT ********/
/**
Thinning out data (dropping every Nth record from display)
This is basically an attempt to keep the graph drawing engine
From being overloaded with data (it will take forever)
There are two supported ways of skipping data
SQL and CODE (or AUTO - below)
Code will read all data for the requested timeframe, and then
decide what to skip. This results in more datatransfer from DB
but a much smoother distribution of points (read on)
SQL complicates the WHERE part of the select statement by restricting
time to being less than a calculated amount per hour,day,month, etc
this is crude but fast, and results in a dense bunch of points at the
beginning of each calculated interval.
This mode relies on the collectionInterval (below) and
will not be accurate if data for different sensors is
collected at different intervals, or if the data has
been selectively purged for any reason
A combination mode of AUTO allows the program to auto-detect when to use which
It uses the threshold below. Setting it to AUTO will result in a
count query ran every time, allowing to decide which method to use.
Count queries don't take a significant amount of time.
How will you know which mode it's using?
Well first of all, the graph will show
"Measurements shown 3233/9899" at the bottom, where 9899 is the total amount.
If that amount exceeds your threshold below, then it's using SQL.
The other indicator is that graph edges are particularly jagged in SQL mode.
**/
$conf['data']['thinOutMethod'] = "AUTO";
// ------ This is for AUTO thinOut method -----
//In AUTO mode (above), how many readings must
//there be to switch to SQL+CODE method of thinOut
//over just CODE mode for thinout
//For my XP1800+ CPU the value of 50000 seems good
//it slows down noticeably as you get closer to 100K
$conf['data']['thinOutAutoSQLThreshold'] = 50000;
// ------ This is for CODE/AUTO thinOut method -----
//First I need to know how often temperature is collected
//This is in minutes. This should agree with the interval
//in your cron schedule, if the itervals are uneven -
//put in average number of minutes
//This setting affects the SQL thin Out method
$conf['data']['collectionInterval'] = 5; //minutes
// -------- This is for all thinOut methods --------
//The algorithm will attempt to thin out the data to a point
//where the resulting datapoint count will be below this value
//Setting this to a reasonable value
//will keep rendering time reasonable
//This value is the total points for all sensors being displayed
//Note that having collectionInterval set correctly
//is imperative to correct guessing
$conf['data']['maxThinnedOutDataPoints'] = 1000;
/************** HTML Properties *********************/
/****************************************************/
$conf['html'] = array(); //no movo this lino
//Background color for main page
//as well as graph margin
//Tip: using simple colors (FF,DD, etc) usually
//yields exact color matches between graph margin
//and HTML background
$conf['html']['bgcolor'] = "#DDDDFF";
/***** FORM submission METHOD *****/
//set to GET to be able to bookmark the url
//with all the options,
//set to POST to have have a more aesthetically pleasing URL
//NOTE - cookies offer a more flexible way of
//remembering settings - see below
$conf['html']['formMethod'] = "POST";
/************ PREFS *************/
$conf['prefs'] = array();
//enable cookies for saving
//user preferences
$conf['prefs']['cookieenable'] = true;
//name for prefs cookie
$conf['prefs']['cookiename'] = 'dtgraphprefs';
//lifetime for prefs cookie, seconds
$conf['prefs']['duration'] = 31536000; //one year
/************** ALARMS ******************************/
/****************************************************/
// Enable alarm checking - if this is off, no new
// alarms will be raised or lowered
// Alarm checking is done via cron when you run
// alarms.php (or logger.php, see below)
$conf['alarms']['enable'] = true;
// Enable alarm checking whenever logger.php
// is run (depends on 'enable' also)
// If this is enabled, you only need one cron job -
// to invoke 'php logger.php'
// If you'd like to update alarm info less frequently,
// or if you're not using logger.php,
// you can set this to false and add 'php alarms.php' to cron
$conf['alarms']['onLogger'] = true;
//Enable alarms display support... this makes dtgraph
//check for active alarms every time the main page is hit
// but this doesn't actually raise alarms!
//This is the default value for the checkbox on the interface
$conf['alarms']['display'] = true;
//Notify whenever an alarm is raised
//This option applies to the admin
//script which gets run on a cron (optional)
$conf['alarms']['notify'] = true;
$conf['alarms']['notifyEmail'] = 'system-alert';
//format (for date() function) to show dates in html
$conf['alarms']['dateformat'] = 'm/d g:i A';
/****************************************************/
$conf['version'] = '0.4n';
?>
Po krótce wyjaśniłem opcje które zmieniamy i ustawiamy.
U mnie do poprawnego odczytu czujników temperatury wymagały edycję w katalogu admin/logger.php
Zmiana polegała na zmianie linii:
$command = $conf['digitemp_binary'].' -q -a -o"%R %.2F" -c '.$conf['digitemp_config'];
na
$command = 'digitemp_DS9097 -q -a -o"%R %.2F" -c /root/.digitemprc';
Pozostało tylko dodać wykonywanie odczytu teperatury do crona, aby cyklicznie się odświerzała temperatura:
crontab -e
i doklejamy:
*/5 * * * * php -f /var/www/dt/admin/logger.php >> /dev/null 2>&1
Oczywiście musisz zmienić scieżkę do katalogu DTGrapha jeżeli masz inna.
Polecam również zabezpieczyć hasłem katalog /admin aby niepowołane osoby tam nie zaglądały.
Efekty pracy:
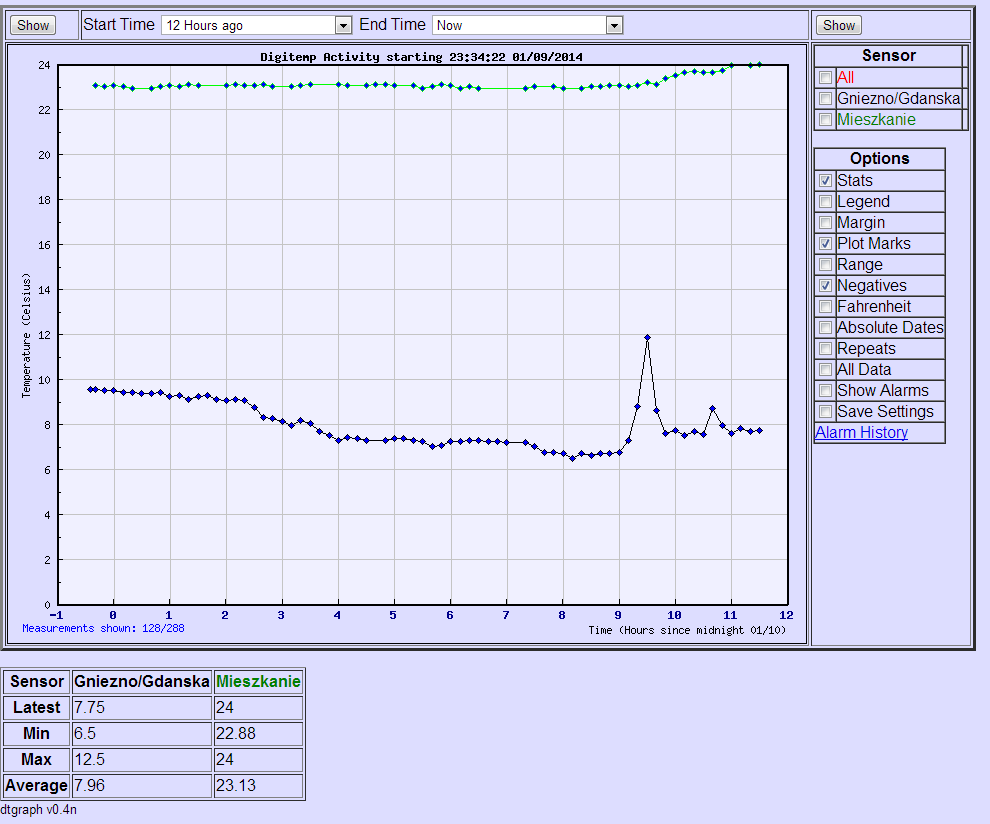
Przykład działania ( już od około pól roku działa nieprzerwanie):